How Creative Intelligence Software Unifies Ad Research and Results
Creative intelligence software unifies public competitor ads and authorized Meta performance data into evidence-backed test briefs.
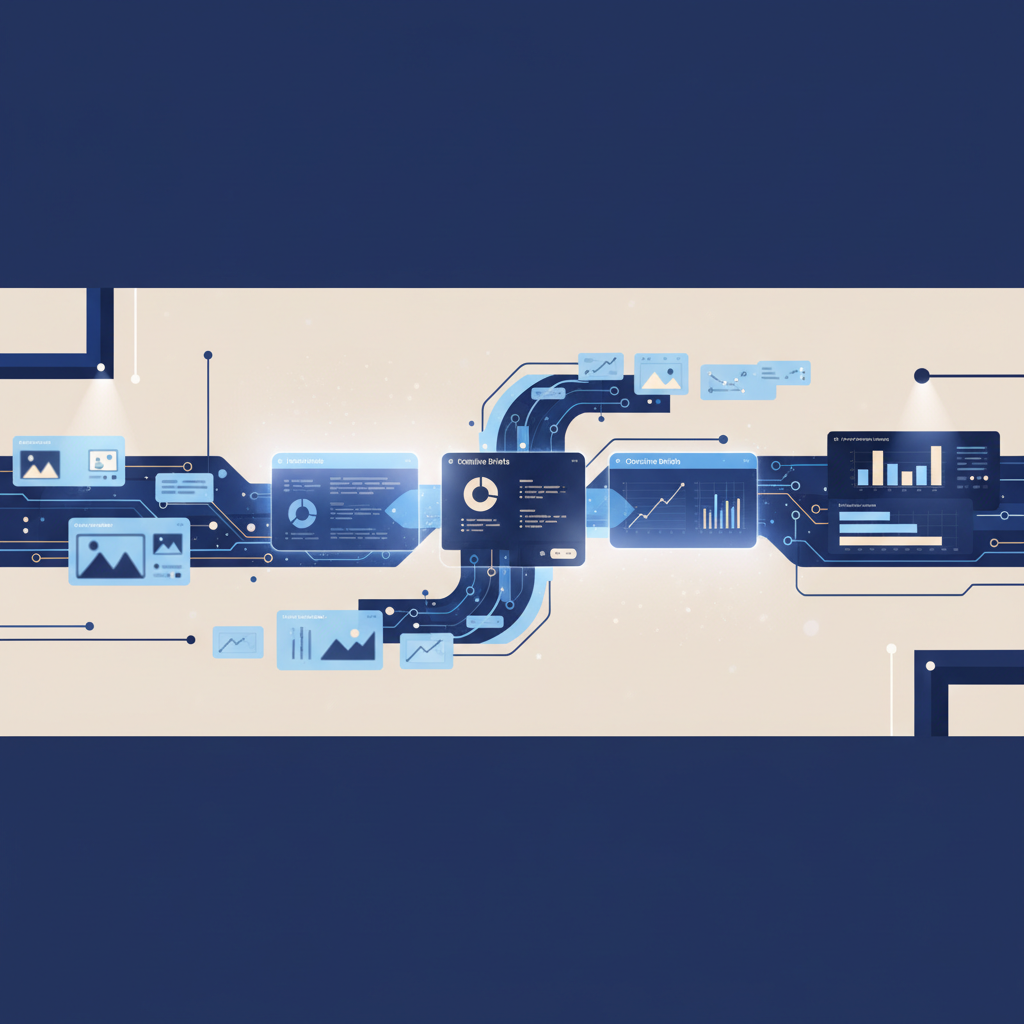
Paid social teams rarely lack data. They lack a reliable way to connect it. A spreadsheet review of 88 operational spreadsheets found a weighted average 1.2% cell error rate, a reminder that manual reporting becomes fragile when many people, versions, and creative changes are involved.
Creative intelligence software combines public competitor-ad observations with authorized performance data from your own accounts; it cannot reveal a competitor’s private conversion metrics. We use it to preserve creative changes, classify hooks and offers, connect our ads to spend and outcomes, and turn repeated evidence into prioritized research and testing briefs.
This guide explains the source boundaries, data architecture, implementation workflow, and practical buying decision behind a unified competitor-ad research and conversion workflow.
What Does Creative Intelligence Software Unify, and What Cannot It See?
The useful distinction is simple: competitor activity is a market signal, while conversion performance is first-party evidence. We can observe what advertisers make public, including their creative, copy, offers, destinations, and changes over time. We can only measure spend, attributed conversions, revenue, and ROAS when an advertiser authorizes access to its own account.
That boundary makes the system more useful, not less. Public research helps us see category movement and recurring creative choices. Our own reporting shows whether a comparable idea worked for our audience, landing page, conversion event, and attribution setting. The resulting recommendation is a test hypothesis, not a claim that we know a competitor’s results.
For commercial ads, Meta’s Ad Library is a public view of ads currently running across Meta products. It is not a complete commercial-ad history or a private reporting interface. We use it as an observation layer, then preserve our own dated snapshots so a team can see what changed after the fact. Our competitor research guidance covers the practical research discipline behind that layer.
Which Sources Create a Reliable Record?
A reliable workflow gives every field an owner and every observation a boundary. It does not mix a public creative signal with a private conversion metric, then present both as though they came from the same source.
| Source | Fields To Capture | Privacy Boundary | Refresh Method | Reliability |
|---|---|---|---|---|
| Meta Ad Library | Advertiser, creative, copy, CTA, destination, observed timing | Public observations only | Scheduled observation and snapshots | Active commercial ads, not a complete commercial archive |
| TikTok Creative Center | Creative examples, region, industry, objective, public ranking signals | Public benchmark signals only | Scheduled review and snapshots | Useful for discovery, not private account reporting |
| Authorized Meta Account | Ad IDs, spend, impressions, clicks, actions, values | Only the connected advertiser account | API or approved export | First-party platform reporting |
| Authorized TikTok Account | Ad IDs, spend, purchases, cost per purchase, ROAS | Only the connected advertiser account | API or approved export | First-party platform reporting |
| First-Party Analytics Or CRM | Conversion event, order value, lead quality, lifecycle outcome | Brand-controlled data | Approved ETL or warehouse sync | Requires explicit identity and attribution rules |
TikTok’s public dashboard lets teams filter by region, industry, campaign objective, likes, and time frame, then sort using signals such as reach, CTR, view rates, and CVR. Those public dashboard filters are valuable for research, but they are not an export of another advertiser’s spending or purchases.
The source table also prevents a common reporting mistake. A competitor ad that remains visible may be worth studying, but it is not proof of profitability. Likewise, an ad that disappears from a public source should be recorded as “last observed,” not declared removed or unsuccessful. Our strategic alternatives guide explains how to make that research more useful than a static swipe file.
How Does the System Turn Signals into Briefs?
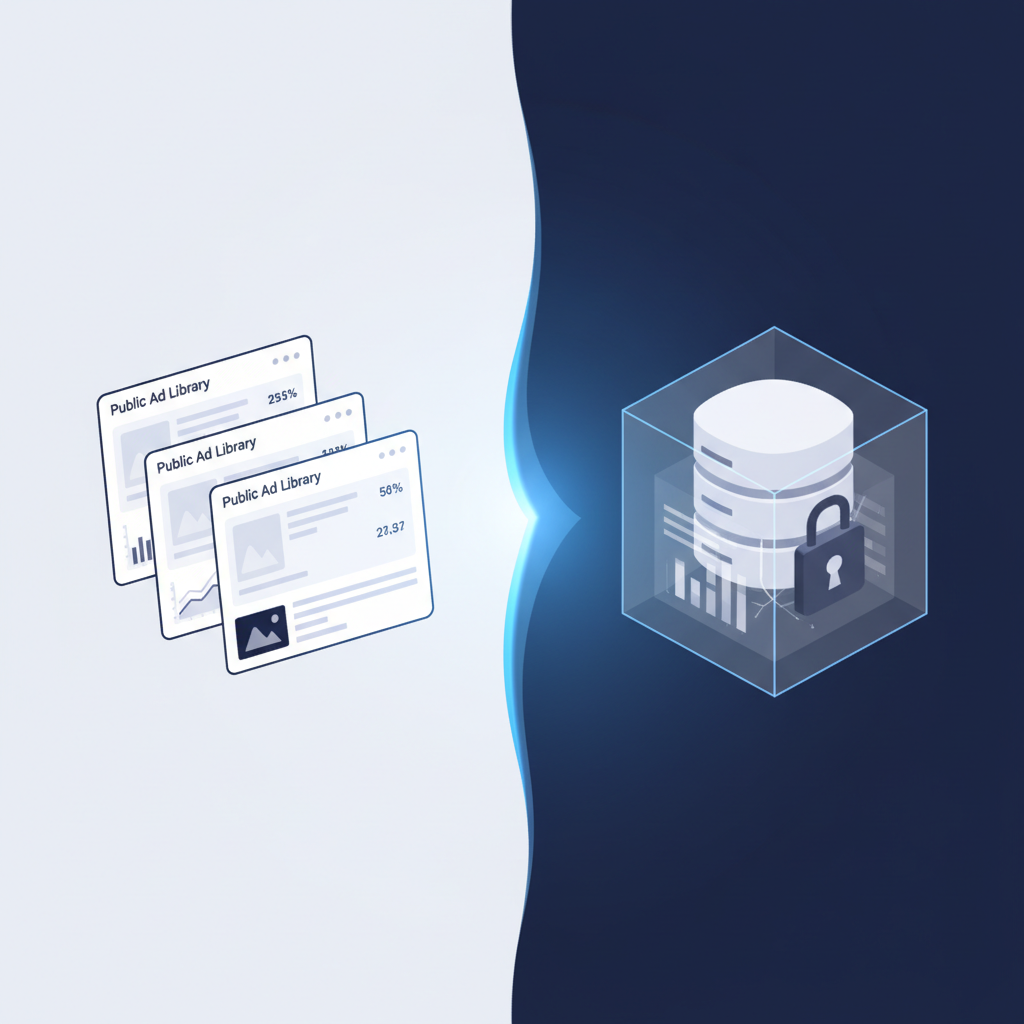
We build the workflow around identity before analysis. Without a consistent record of what an ad is, when it was observed, which landing page it used, and which concept it represents, a dashboard only organizes fragments. With that model in place, research becomes traceable and performance conversations become easier to audit.
How Do We Identify the Same Creative Across Records?
For our own ads, platform ad IDs and creative or asset IDs provide the deterministic join to performance reporting. We also normalize landing-page URLs and retain campaign and ad-set metadata, so creative context is not lost when an asset appears in multiple campaigns.
For public ads, we store the advertiser identifier, source URL, observed timestamp, creative and copy hashes, destination, and snapshot. These are observation keys, not account keys. They support comparison and historical tracking without implying access to private advertiser data.
How Do We Classify Hooks, Offers, and Angles?
We use a shared taxonomy for format, audience problem, hook, proof, offer, objection, CTA, and landing-page promise. Automated transcription, OCR, and classification can speed up the first pass, but people should review high-impact labels and changes to the taxonomy.
That structure lets us group variants into a concept without erasing the evidence. It also makes an angle performance view possible: the team can compare a recurring promise with its own conversion outcomes rather than treating every asset as an unrelated one-off.
How Do We Join Conversions to Creative IDs?
Our authorized Meta reporting can return ad-level fields including ad ID, clicks, impressions, spend, actions, and action values through an API reporting example. We retain the selected date range and attribution setting alongside every score, because a conversion number without that context is not comparable.
We then distinguish platform-attributed results from independent analytics or CRM outcomes. When a creative ID cannot be matched, we flag it. We do not fill the gap with inference and call it measurement.
How Do We Turn Evidence into a Better Brief?
A useful brief names the concept, audience, hook, offer, format, proof, landing-page alignment, success metric, and stop rule. It should also carry its evidence: public examples, our own historical tests, freshness, confidence, and any saturation risk.
That record becomes a testing memory, not another weekly screenshot folder. The point is to make the next decision easier to explain, revise, and learn from.
How Can a Team Implement the Workflow in Seven Steps?
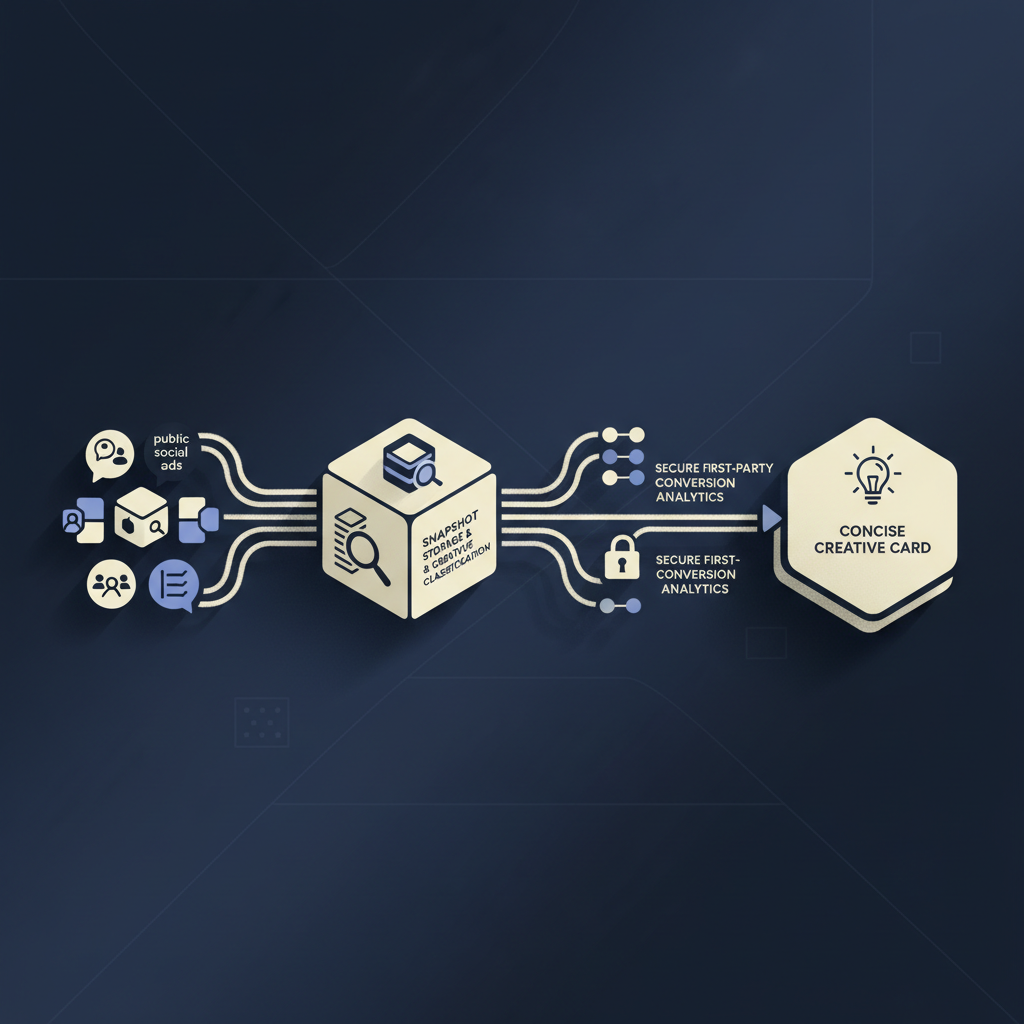
The fastest implementations begin with a narrow decision: which creative concepts should we test next? Starting there keeps the source model, taxonomy, and reporting requirements focused. A broad “single source of truth” project usually becomes difficult because it tries to answer every marketing question at once.
-
Name The Decision: Set the competitor set, category, markets, channels, conversion event, attribution window, and weekly owner before connecting data.
-
Define The Taxonomy: Agree on the hook, offer, format, proof, objection, and landing-page fields that creative and performance teams will actually use.
-
Collect Public Observations: Capture source URLs, timestamps, creatives, copy, destinations, and hashes from permitted public sources. Store raw snapshots separately from derived labels.
-
Connect Authorized Reporting: Pull the brand’s ad-level reporting through approved APIs or exports. TikTok’s own reporting documentation includes spend, purchase, purchase-rate, and ROAS metrics for authorized advertiser reporting.
-
Validate The Join: Reconcile a sample of ad IDs, dates, spend, and conversions against source reporting. Flag unmatched assets, incomplete days, and changed attribution windows.
-
Rank Test Opportunities: Score concepts by evidence quality, recurrence, freshness, first-party results, and production effort. Use concept prioritization to keep the score tied to a decision.
-
Run The Learning Loop: Review briefs weekly, record outcomes, and audit taxonomy and data quality monthly. Include fatigue analysis so declining results are not automatically blamed on the creative.
This is an ETL problem as much as a creative problem. ETL combines and organizes inputs from multiple systems into a consistent dataset, which is why provenance, validation, and controlled transformations matter before a team relies on a recommendation.

Should We Build, Use Native Sources, or Buy?
The right choice depends on the decision deadline, the internal data capability, and the amount of analyst effort the team can sustain. A dashboard can visualize data well, but it does not automatically create public snapshot history, a creative identity model, governance, or production-ready briefs.
| Decision Factor | Deepsolv | Custom Looker Stack | Native Sources And Internal Workflow |
|---|---|---|---|
| Best Fit | Teams needing research, classification, and briefs in one operating workflow | Teams with dedicated data engineering and BI ownership | Teams validating a narrow process before committing |
| Two-Week Target | Confirm implementation scope before committing | Not appropriate to promise without an existing modeled warehouse | Can begin quickly, but remains analyst-heavy |
| Ongoing Maintenance | Confirm vendor coverage and support during evaluation | Internal team owns connectors, models, QA, alerts, and taxonomy | Internal owner maintains collection, snapshots, and interpretation |
| Analyst Effort | Focuses analyst time on decisions and review | High, especially for data modeling and taxonomy upkeep | High and recurring |
| Governance | Evaluate controls, retention, access, and export terms | Fully configurable, fully owned | Must be designed and maintained internally |
| Cost Position | Request a written quote and scoped inclusions | Quote-based annual commercial terms | No assumption that source access removes labor or storage cost |
A custom BI deployment should not be selected simply because it has dashboards. Current Looker pricing is quote-based and annual, while Standard includes 10 standard users, two developer users, and 1,000 query-based API calls per month. That may suit an established data program, but it does not establish that a custom build will fit a fixed monthly budget or a short launch window.
For a team with a $3k monthly ceiling and a two-week target, we would first require a written scope, onboarding commitment, source coverage, governance answers, and price. If those conditions are not met, start with a focused native-source workflow rather than pretending a new custom stack is already complete. Our platform selection framework helps teams separate reporting needs from decision-workflow needs.
Why Choose Deepsolv for This Workflow?
At Deepsolv, we help paid social teams replace scattered observations and reporting exports with a decision workflow. Our platform brings together competitor moves, customer signals, and historical ad learnings so the team can decide what to test, improve, or stop. The point is not another gallery of ads. It is a durable record of concepts, evidence, and outcomes that makes the next brief easier to defend.
That approach helps performance and creative leaders work from the same definitions of a hook, offer, angle, and conversion result. We retain the boundary that matters: public activity informs research, while account-authorized data informs performance decisions. If your team needs a defensible weekly test plan instead of more spreadsheet maintenance, we can show the workflow around your sources, reporting windows, and governance requirements, with clear ownership from research through creative production. Start with a book a demo.
FAQs on Creative Intelligence Software
Can Creative Intelligence Software See a Competitor’s ROAS or Purchases?
We cannot see competitor spend, ROAS, purchases, audiences, or account reports. We analyze public creative observations and connect outcomes only to your authorized account data.
Does Meta Provide a Complete Commercial Ad History?
Meta exposes active commercial ads publicly, but that view is not a complete commercial archive. Its seven-year archive applies only to political and issue advertising.
Which TikTok Signals Are Public?
Public TikTok views show platform-provided creative signals and filters. Private spend, purchase, and ROAS reporting require authorization for the advertiser account before use by us.
How Do We Map Sales to Creative?
We join authorized ad IDs to performance records, retain selected date ranges and attribution windows, and flag comparisons whenever those methods or windows differ materially.
Can a Two-Week, $3k Monthly Rollout Work?
Two weeks is feasible when data access, scope, governance, and onboarding are confirmed. We require a written quote before calling this budget fit realistic today.
Does a Dashboard Replace the Full Workflow?
A dashboard visualizes modeled data, but it cannot preserve public snapshots, classify creative meaning, or produce accountable test briefs without workflow design and governance oversight.