
Creative Fatigue vs Competitive Pressure: How to Diagnose Declining Meta and TikTok Ads


TL;DR
We diagnose creative fatigue vs competitive pressure by comparing asset-level decline with frequency, reach, CPM, conversion rate, delivery changes, and rival-message evidence. This guide gives our five-step method, account-specific baselines, alert rules, and next actions for Meta and TikTok portfolios.
When an ad account changes, speed matters, but certainty matters more. TikTok says learning-phase volatility typically begins to decline after about [25 campaign results or seven days](https://ads.tiktok.com/help/article/learning-phase?redirected=1), which is one reason a sharp early drop can be a delivery effect rather than a failed creative.
Creative fatigue vs competitive pressure cannot be resolved from CTR alone. We diagnose a decline by comparing asset-level attention and conversion changes with frequency, reach, CPM, placement, delivery, attribution, and rival-message evidence. Fatigue is likeliest when one mature asset weakens while comparable fresh assets remain stable.
Here, we show how to make that call across Meta and TikTok, set safer alerts for portfolios with 40 or more variants, and choose the next action without pausing a viable ad too soon.
What Does Ad Fatigue Look Like in Meta and TikTok Results?
Ad fatigue is not simply an ad with a lower CTR than last week. We treat it as a repeated loss of response from a proven asset after it has received meaningful delivery, while comparable assets still have room to perform. That distinction prevents a temporary auction shift from being mislabeled as a creative failure.
TikTok’s own fatigue guidance combines day-to-day changes in CPA, reach rate, and performance. Its native fatigue index reaches 0.6 when an ad group has a lower ability to reach new users and drive results. We use that as a useful platform-specific signal, not as a universal threshold for every account.
The pattern matters more than the calendar age of an ad. One mature video can lose hook rate, hold rate, CTR, and conversion rate while a fresh execution of the same offer remains steady. That is strong evidence of asset decay. If several ads lose performance together, frequency rises, reach growth slows, and CPM climbs, we investigate saturation, auction conditions, offer relevance, or delivery changes first.
Meta’s ad auction evaluates objective, budget, duration, audience, and creative. That means performance can shift when delivery finds a different pocket of inventory, even if the ad file has not changed. We preserve that context in our fatigue diagnosis guide before deciding whether an asset has actually worn out.
Which Metrics Lead CPA Deterioration?
CPA is the scorecard, but it is usually late to the story. By the time it rises, the account may have already shown weaker attention, higher inventory costs, poorer traffic quality, or a changing audience mix for several days.
We separate leading signals from confirmation signals. That gives our teams a reason to investigate early, without turning every normal fluctuation into a pause decision.
Attention Signals: Hook Rate and Hold Rate
Hook rate tells us whether an opening earns the next moment of attention. Hold rate tells us whether the viewer stays after the opening. Neither metric has one cross-platform definition, so we compare the same native view threshold, placement, audience, and format over time.
A falling hook rate with stable hold rate often means the opening frame, first claim, or first line has become familiar. A stable hook rate with falling hold rate usually points later in the execution, such as pacing, proof, product demonstration, or message-to-offer fit. TikTok distinguishes short video-view measures and completion measures in its reporting definitions, so we avoid treating every view metric as interchangeable.
Traffic Signals: CTR, CPC, and CPM
CTR is an early warning because it captures the response after an impression. CPC tells us the effective cost of attracting that response. CPM adds the auction context. If CPM rises across fresh and mature assets, the problem may be inventory cost rather than creative wearout.
A lower CTR does not tell us why the click declined. We compare it with placement mix, frequency, reach growth, and the performance of peer assets. That is why our angle tracking framework separates the strategic message from one visual execution.
Outcome Signals: Conversion Rate and CPA
Conversion rate and CPA confirm whether weaker attention is turning into weaker economic performance. A falling CTR with stable conversion rate can call for a creative refresh. Stable CTR with falling conversion rate sends us toward audience quality, landing-page friction, offer changes, or tracking before we touch the creative.
TikTok’s rule definitions define CTR, CPC, CPM, CVR, and CPA separately, which reinforces a simple rule: each metric answers a different question. We do not make a diagnosis from only one.
Exposure Signals: Frequency and Reach
Frequency is useful only beside reach. Rising frequency with healthy incremental reach is different from rising frequency while the account struggles to find new people. On TikTok, reach is frequently estimated, and totals across ad groups or other reporting cuts do not necessarily equal campaign reach, according to its reach methodology.
For that reason, we use frequency and reach as directional exposure evidence. They help distinguish one stale asset from a constrained audience, but they are not a verdict on their own.
How Does Creative Fatigue vs Competitive Pressure Compare with Saturation and Delivery Change?
The fastest useful diagnosis compares the mature asset with a relevant control. We look for a fresh asset in the same ad set, similar placement exposure, the same optimization event, and a stable attribution setting. Without that comparison, a falling number is just a falling number.
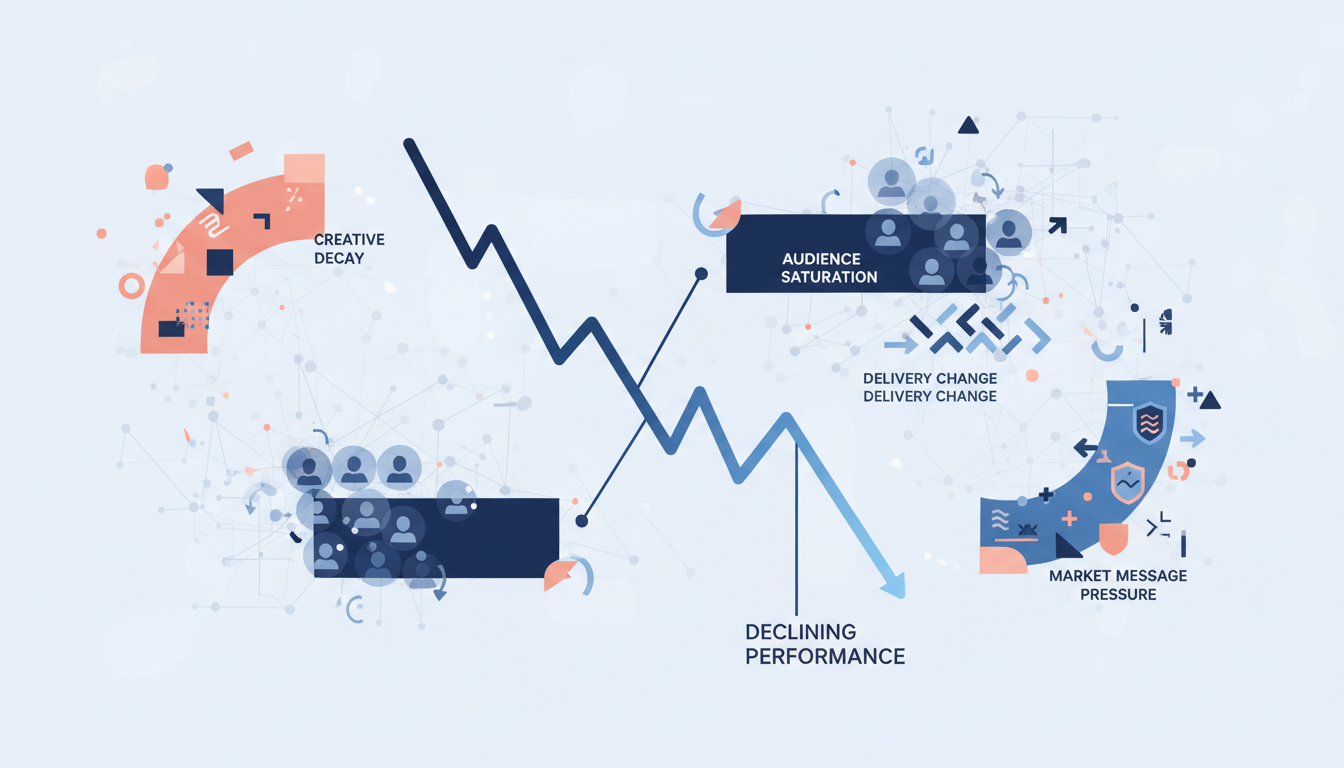
| Observed Pattern | Likely Cause | Confirmation Check | Action |
|---|---|---|---|
| One mature asset loses hook rate, CTR, and CVR while fresh peers remain stable | Creative fatigue | Compare like-for-like placement, audience, attribution, and delivery | Refresh the execution while retaining the proven angle |
| Several assets weaken, frequency rises, and reach growth slows | Audience saturation | Review ad-set reach, audience breadth, exclusions, and overlap risk | Expand qualified reach or redistribute spend |
| Fresh and mature assets weaken together while CPM rises | Auction or competitive pressure | Check external message launches, offer shifts, placement mix, and account-wide CPM | Protect spend and test a differentiated message or offer |
| CTR holds while CVR and CPA worsen | Offer, site, or measurement issue | Review event integrity, landing-page changes, and attribution settings | Fix post-click or measurement conditions first |
| Performance shifts after a major edit | Learning or delivery change | Check budget, bid, targeting, creative, and status history | Observe through learning before judging the asset |
Creative-Level Decay Versus Audience Saturation
Creative fatigue is asset-specific. The clearest pattern is a mature asset declining while a fresh asset, serving to a similar audience under similar conditions, keeps stable hook rate, CTR, and conversion rate. A new execution can use the same strategic angle while changing the first frame, creator, proof, pacing, or format.
Audience saturation is broader. It appears when multiple assets lose response at once, frequency climbs, incremental reach slows, and audience expansion is constrained. Meta can also expand beyond audience suggestions when its systems predict better results, as explained in its audience delivery guidance. We therefore compare delivery behavior, not only the targeting field selected at launch.
Delivery Changes That Create False Alarms
Placement allocation, budget redistribution, bid edits, optimization-event changes, and learning status can all shift performance without proving fatigue. A campaign that moves more spend into a lower-CTR placement can make an asset look weaker at the aggregate level while its matched placement remains healthy.
Attribution changes create the same risk. TikTok advises that changing attribution windows too often can make performance fluctuate in its attribution guidance. We record every material change beside the trend line and remove affected days from a clean comparison where possible.
Competitive Pressure and Message Saturation
External research cannot prove why an auction changed, but it can explain why an established message has become less distinctive. We log new rival launches, offer changes, creative formats, hooks, proof styles, landing-page promises, and dates. If our assets and several market messages converge on the same claim, the right answer may be a sharper proposition rather than another visual variation.
We use the public ad library to review currently active Meta ads, then connect relevant findings to our Meta research workflow. The aim is not to copy a message. It is to recognize when a once-distinct message has become crowded.
How Do We Establish Account-Specific Baselines?
A reliable alert starts with the account’s own history, not a generic threshold pasted from another category. We use a rolling 30-day baseline for stable, post-learning periods, segmented by platform, objective, optimization event, geography, audience type, placement, and format. TikTok Custom Reports supports both 30-day views and trend lines in its custom reporting tools.
For each relevant segment, we track the median and normal range for hook rate, hold rate, CTR, CPC, CPM, CVR, CPA, frequency, and reach. We then exclude periods affected by material budget, targeting, attribution, tracking, or landing-page changes. The output is not a magic number. It is a comparison frame that can show whether a current move is ordinary noise or a meaningful break from the account’s pattern.
Use three alert stages:
- Warning: A leading metric moves beyond the account’s decision threshold after sufficient delivery. Send a notification, but do not pause.
- Investigation: Two or more leading signals worsen, fresh comparison assets remain stable, and no delivery or measurement change explains the shift.
- Action: The investigation pattern persists through the review period and the diagnosis is clear enough to choose a refresh, audience, offer, budget, or observation action.
Our alert template keeps every threshold specific to the account:
Scope: one asset, matched placement, ad set, and attribution setting

IF a metric moves beyond the account baseline
AND delivery exceeds the account minimum delivery gate
THEN create a warning.

IF two leading signals worsen
AND fresh matched assets remain stable
AND no logged delivery, attribution, or tracking change exists
THEN investigate probable asset decay.

IF the diagnosis persists through the review period
THEN take the action assigned to that diagnosis.
This approach is especially useful when portfolios contain 40 or more live variants. We use our creative intelligence approach to organize the comparison by asset, angle, ad set, placement, and age, rather than asking a team to manually reconstruct the context every morning.
What Are the Five Diagnosis Steps?
The best process is deliberate enough to prevent false positives and fast enough to preserve budget. We run the same five steps whether the first warning appears on Meta or TikTok, then adapt the reporting columns to the platform’s native metrics.
Freeze the Comparison Frame
Compare the same objective, optimization event, attribution setup, placement, and date cadence. If these differ, the metric movement may reflect reporting rules or inventory rather than audience response.
Pass the Delivery Gate
Confirm that the asset has enough delivery to be evaluated within that account, then review the change log. New campaigns, ad groups, large budget changes, bid changes, and targeting edits can all restart or disturb learning. TikTok lists these triggers in its learning-phase documentation.
Read Attention Before CPA
Review hook rate, hold rate, CTR, CPC, frequency, reach, and CPM. This identifies whether attention is weakening, exposure is tightening, or inventory is becoming more expensive before CPA obscures the sequence.
Compare the Asset with Its Cohort
Compare the mature asset with fresh assets and the ad-set average. If only the mature asset declines, fatigue becomes plausible. If the cohort declines together, investigate audience, auction, offer, or measurement conditions.
Confirm the Cause and Record the Decision
Check CVR, CPA, event integrity, external message evidence, and the account’s next action. We save the conclusion in our testing memory, so a later team member can distinguish a failed execution from a message that was never properly tested.
What Action Follows Each Diagnosis?
A diagnosis should result in one decisive next move, not a string of simultaneous edits that make the next result impossible to interpret. We change the smallest meaningful variable first, document it, and retain the evidence that led to the decision.
| Diagnosis | Best Next Action | What To Preserve | What Not To Do |
|---|---|---|---|
| Confirmed creative fatigue | Refresh the hook, proof, creator, pacing, or format | The validated audience, offer, and strategic angle | Rebuild every campaign setting at once |
| Audience saturation | Expand reach, adjust exclusions, or redistribute spend | Assets that still work in less-exposed pockets | Blame every asset for a shared audience constraint |
| Competitive pressure | Test a distinct claim, proof mechanism, or offer | What still differentiates the product | Copy a rival’s message without a strategic reason |
| Delivery or learning shift | Hold conditions steady and observe post-learning performance | The pre-change measurement frame | Judge performance immediately after major edits |
| Tracking or post-click issue | Audit events, attribution, landing page, and checkout | The working creative until evidence says otherwise | Refresh creative solely because CPA moved |
When fatigue is confirmed, we refresh the execution, not necessarily the strategic idea. A familiar visual can lose response while the customer problem, proof, or promise still converts. That is where our performance-connected copy tools help carry a validated lesson into the next creative brief.
When the evidence is inconclusive, continued observation is an action too. A warning should create a review task, not an automatic pause. That protects the account from false positives and preserves the learning needed to make the next call with confidence.
How We Help Teams with Deepsolv
We help performance teams turn a crowded reporting view into a disciplined creative decision. We connect creative, angle, audience, and outcome signals so your team can see whether one asset is wearing out, delivery has changed, or a rival message deserves attention. Our workflow keeps the evidence together: creative-level trends, ad-set context, comments, and test history. That makes it easier to preserve a winning angle while replacing the execution, instead of pausing ads because one dashboard number moved. We also help teams turn diagnosed patterns into the next brief, so each refresh carries forward what the previous test taught us. If your account contains dozens of variants, we give the review process a shared memory and a clear handoff between media, creative, and strategy. You can give every decision an owner, a confirmation check, and a recorded next action. Start with Deepsolv.
FAQs on Creative Fatigue vs Competitive Pressure
How Do You Detect Meta Ad Fatigue Early?
We detect fatigue early by flagging sustained asset-level declines in hook rate, hold rate, or CTR after sufficient delivery, then comparing frequency, reach, CPM, and fresh assets.
What Metrics Separate Creative Fatigue from Audience Saturation?
We diagnose audience saturation when several assets weaken together, frequency rises, reach growth slows, and audience expansion is constrained, rather than one mature asset deteriorating alone.
Should Falling CTR Automatically Pause an Ad?
No. We treat CTR as a warning, not a verdict, because placement shifts, CPM, learning, attribution, tracking faults, and post-click issues can create similar patterns in practice.
How Should Teams Monitor More Than 40 Variants?
For 40 or more variants, we group daily reporting by asset, angle, placement, and ad set, apply delivery gates, compare rolling baselines, then alert before action.